




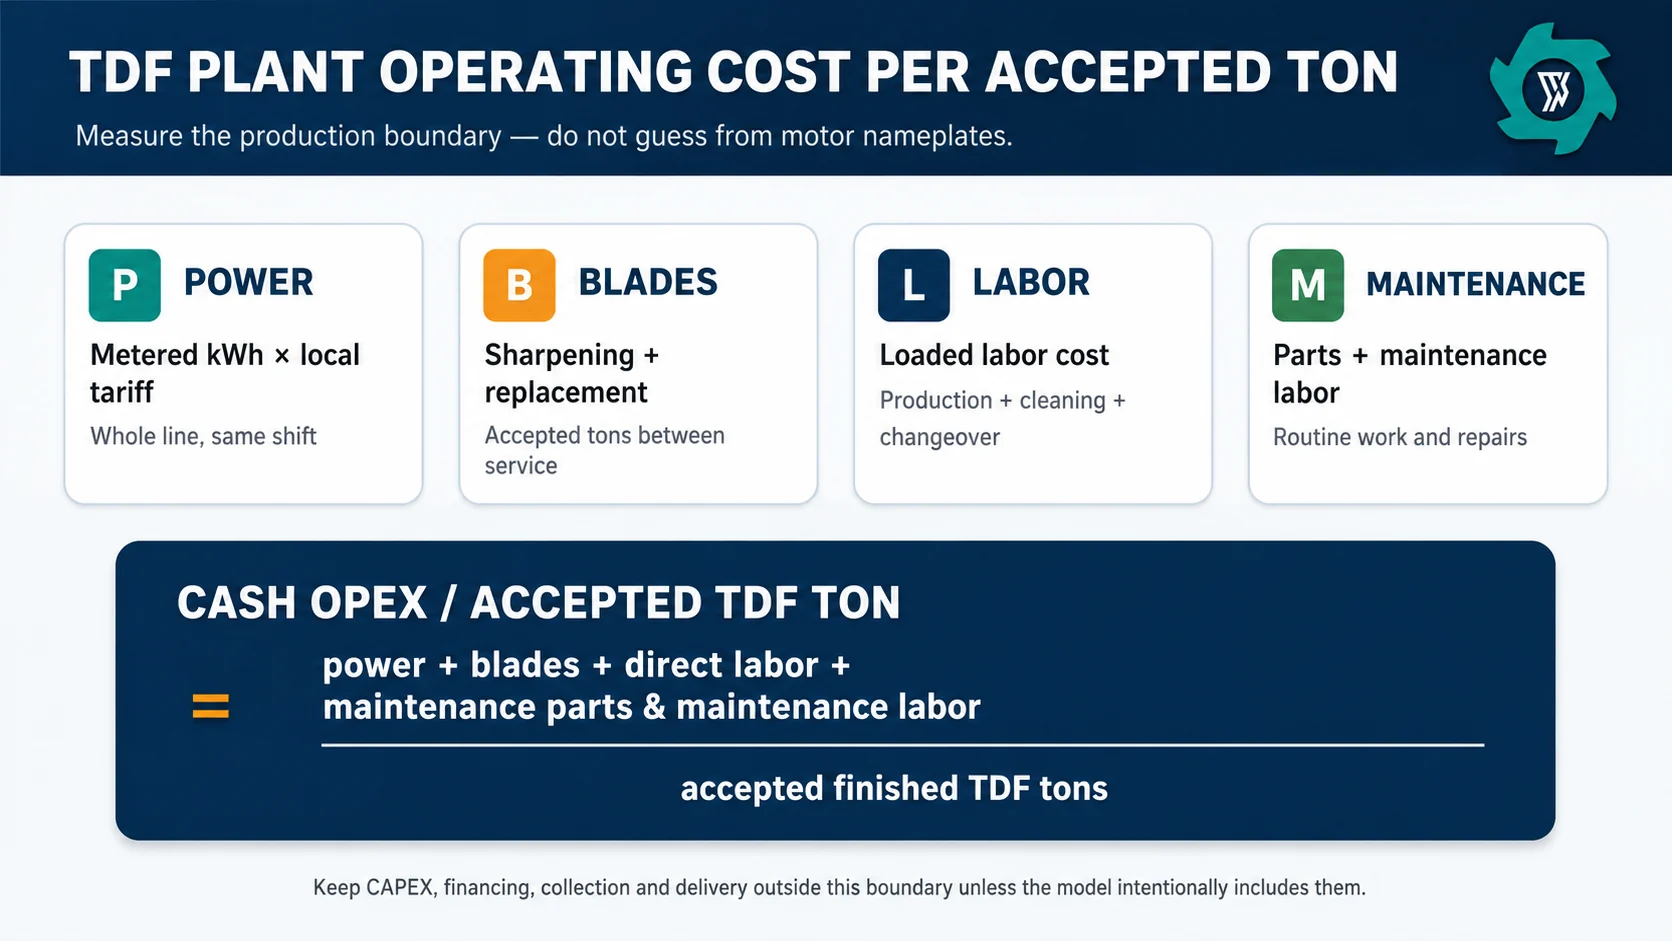
A TDF plant does not have one reliable operating cost per ton. The number changes with the tire mix, the product the fuel buyer accepts, the screen-return load, blade condition, local electricity tariff, labor arrangement and how much of each shift becomes accepted output. The useful number is therefore not a brochure estimate. It is a measured cash operating cost per accepted finished TDF ton.
First Define What “Operating Cost per Ton” Includes
The cleanest boundary is the plant gate: tires enter the agreed preparation and shredding route, and the denominator is the TDF that leaves the line and passes the receiver’s written physical acceptance rules. EPA notes that some fuel users can accept whole tires while others require processed tire chips, so the required preparation depends on the receiving system.1 Collection trucks, long-distance delivery, equipment depreciation, financing and corporate overhead can be added later, but they should not be mixed into the first machine-performance benchmark.
Incoming tire tons are easy to weigh, but they do not tell you how much accepted fuel the shift produced. A return loop may keep oversize pieces in circulation. Some feed may be held because it does not meet the finished specification. Maintenance stops may reduce the amount that reaches the accepted-product bin. If the goal is a production decision, divide by what the customer can actually receive.
The current YUXI Tire TDF Plant uses a mechanical route with tire preparation where required, shredding, screen-controlled sizing and oversize return. YUXI publishes 50–80 mm as the standard TDF direction and an approximate 50–150 mm adjustable range. The same page notes that a smaller screen increases recirculation and that blade life changes with tire construction, foreign metal, feeding stability and maintenance. Those are not separate details; they are direct OPEX variables.
| Cost line | What belongs in it | Best normalization | Common mistake |
|---|---|---|---|
| Electricity | Shredder, screen, return conveyor, feed/discharge conveyors, hydraulic preparation equipment and other auxiliaries inside the chosen boundary. | kWh / accepted TDF ton | Using installed motor kW as if every motor ran at full load for the whole shift. |
| Blades and wear | Replacement or sharpening, wear parts, freight, blade-change labor and service consumables. | $/accepted ton between comparable service events | Quoting blade life in hours without recording tire mix or processed mass. |
| Direct labor | Feeding, inspection, control, finished-product handling, housekeeping and routine production support. | labor hours and loaded labor $ / accepted ton | Counting only the control-panel operator while ignoring loading and stoppage work. |
| Maintenance | Lubrication, bearings, belts, hydraulic items, screen/fastener work, sensors, repairs and maintenance labor. | $/accepted ton plus downtime minutes by cause | Recording only emergency spare parts and missing preventive work. |
EPA’s scrap-tire management handbook describes labor, power and maintenance among the major variable processing-cost components and also warns that labor and utility costs vary by location; it notes that motors do not generally operate at full capacity.2
1. Power Cost: Meter kWh, Do Not Multiply Nameplate kW by Shift Hours
A connected-load schedule is needed for electrical design, but it is a weak operating-cost estimate. Tire shredders see changing load as material enters the cutting chamber. Conveyors may run lightly loaded. Hydraulic preparation equipment cycles rather than drawing full load continuously. The screen and return conveyor can continue working even when the fresh-feed rate changes. A realistic energy number comes from a meter across the equipment boundary you are costing.
The calculation is simple once the measurement is correct:
(metered whole-line kWh ÷ accepted TDF tons) × local $/kWh
If the tariff includes demand charges, allocate the relevant demand cost separately instead of hiding it inside a guessed energy rate.
The U.S. Energy Information Administration’s June 2026 state table, released August 26, shows substantial variation in industrial electricity prices even within one U.S. region. That is enough to make a universal “power cost per ton” misleading.3 A project model should use the actual industrial tariff, time-of-use rules and demand structure that apply at the site.
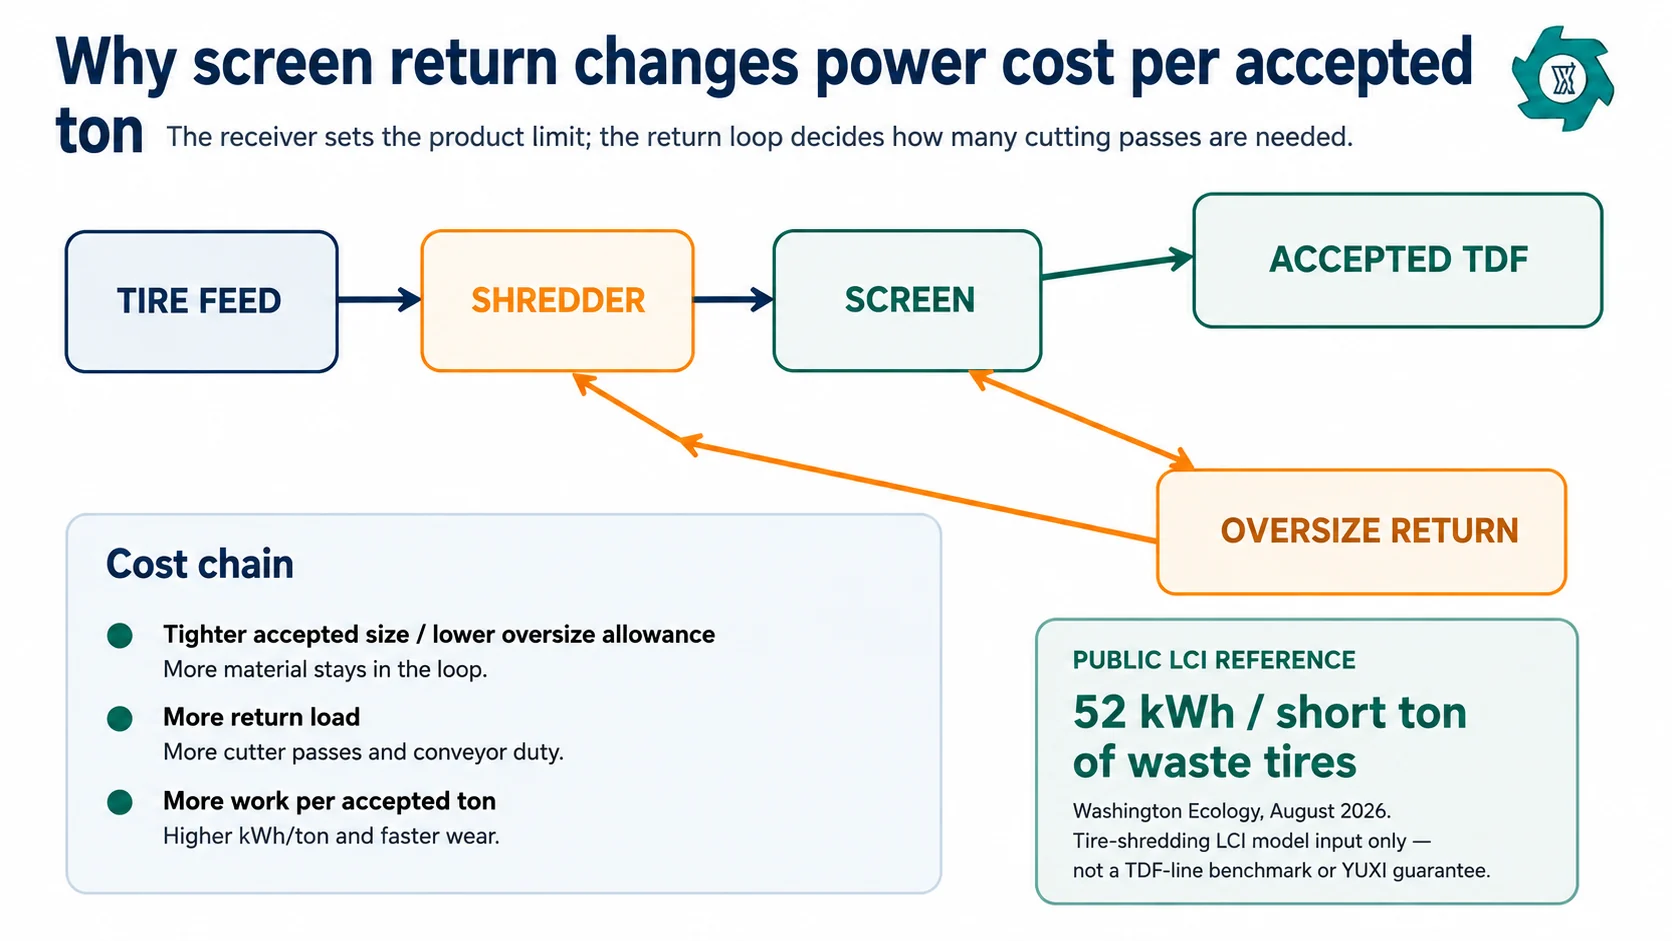
A 2026 Washington State Department of Ecology LCA report uses 52 kWh per short ton of waste tires as an electricity input for its tire-shredding model.4 This is only an external LCI reference point, not a TDF-line benchmark or a kWh-per-accepted-ton figure. Tire type, preparation, target chip size, screen return, equipment design and operating method can move the actual number.
Measure idle and return-loop energy separately when the number looks high
If kWh per accepted ton rises, do not immediately assume the shredder is inefficient. Check what happened to the denominator and to the material path. A blocked discharge, long bin change, repeated overload reversal, empty upstream feed or a high oversize-return rate can all leave auxiliaries running while accepted output falls. The first diagnostic should combine the energy meter, accepted scale weight and stoppage log for the same time window.
2. Screen Return Is an OPEX Multiplier, Not Just a Capacity Issue
The detailed chip-size limits belong in a finished-product specification, not in an operating-cost article. If the receiver has not defined them yet, use the separate TDF quality specification guide to settle the acceptance boundary first.
A tighter screen does not automatically mean a fixed percentage increase in cost. Tire shreds are irregular, blade condition changes chip shape, and the tire mix affects how quickly pieces reach the passing size. The site should therefore record return-loop behavior rather than apply a generic multiplier. If practical, weigh or estimate oversize return during a test and compare it with accepted finished output. Even a simple ratio gives maintenance and production teams a better diagnostic than “the line feels slower.”
oversize return mass ÷ accepted finished TDF mass. The exact measurement method can be project-specific, but keep it consistent when comparing screen settings or blade condition.3. Blade Cost per Ton Is a Lifecycle Calculation
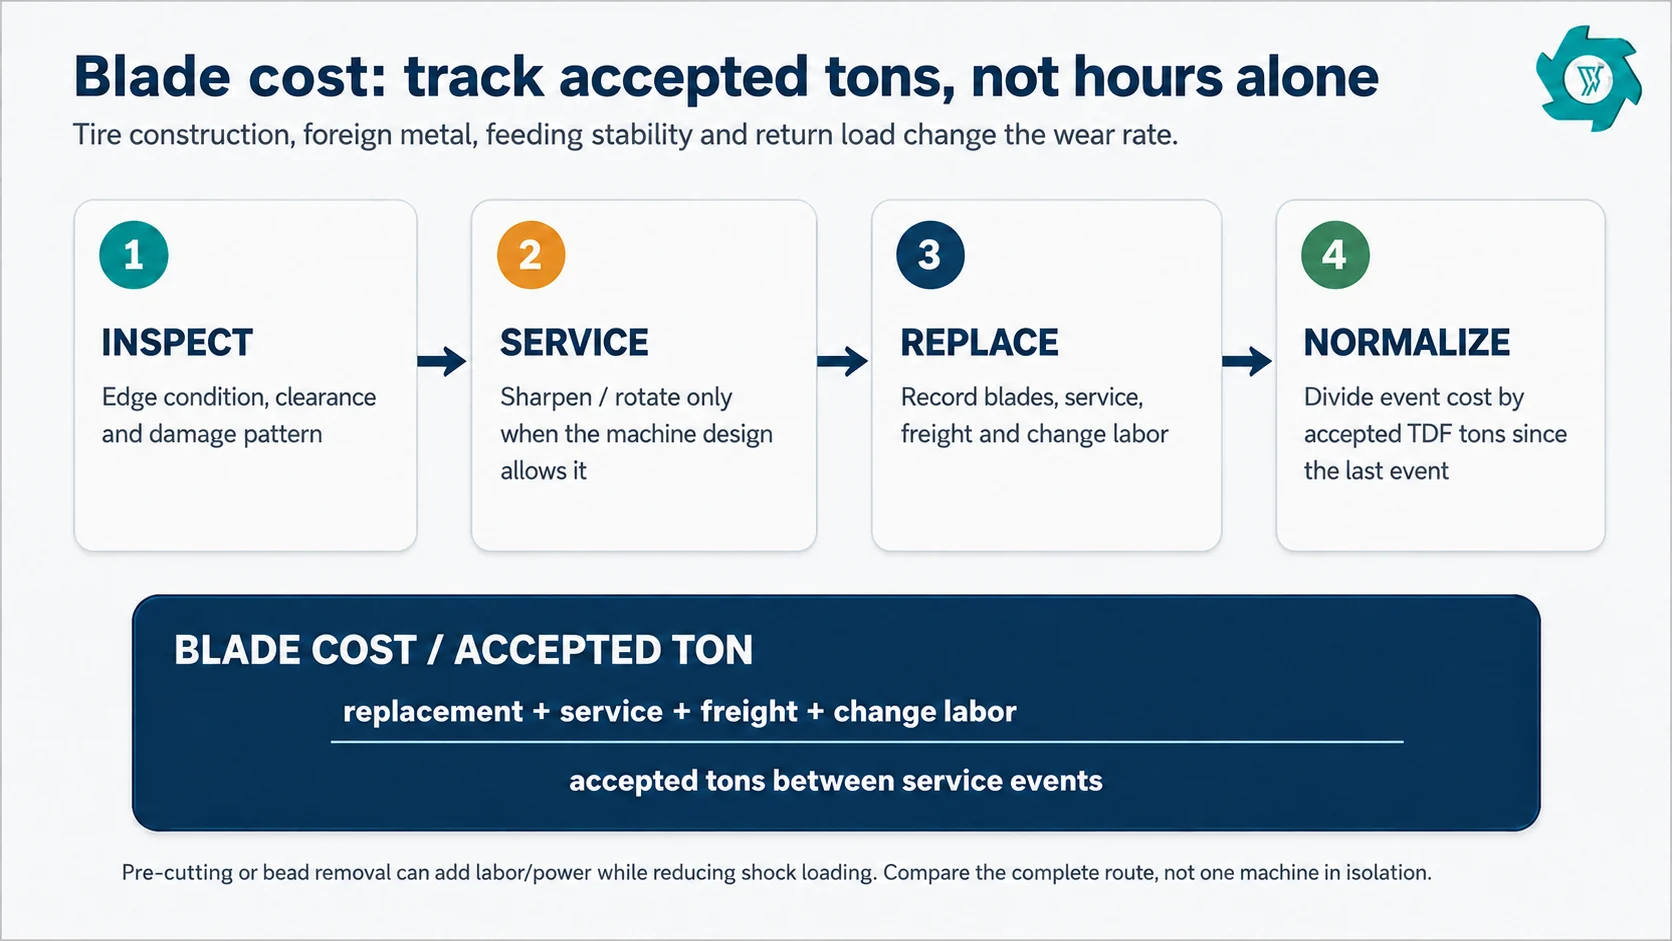
Blade cost is often reduced to one purchasing question: “How many hours will the blades last?” A set of cutters may see passenger tires, truck tires or a mixed stream. Some tires arrive with concentrated bead steel already removed; others do not. Foreign metal incidents can damage an edge in minutes. A tighter screen can also keep material in the cutting loop longer, increasing cutting work per accepted ton.
YUXI’s pillar page gives more than 2,000 working hours as a reference for replaceable blades while explicitly stating that actual service life changes with tire construction, foreign metal, feeding stability and maintenance. The correct way to turn that reference into a site cost is to build a service history. For every blade event, record the feed mix, blade position or set ID, accepted tons since the previous comparable event, why service was needed, the parts used and the labor required.
Bead removal and pre-cutting create a trade-off
Removing concentrated bead wire or pre-cutting a large stiff tire adds equipment cycles, labor or electrical demand upstream. It can still lower the cost of the complete route if it stabilizes feeding and reduces shock loading or abnormal blade damage. The separate bead-removal guide owns the detailed equipment decision. For OPEX, the rule is simply to compare the full route under the same accepted-output target. Do not call an upstream step “extra cost” while ignoring a downstream wear reduction, and do not assume the wear reduction without measuring it.
4. Labor Cost per Ton Depends on the Work Around the Shredder
Automation can move labor from repetitive handling to monitoring and maintenance, but it does not remove the need to manage feed, contaminants, finished material and stoppages. A TDF shift may include tire receiving and inspection, loader or conveyor feeding, debeading or cutting where required, control-panel work, quality checks, bin changes, housekeeping, jam recovery and maintenance support.
Use loaded labor cost if the purpose is a business model — wage plus the employer-side labor burden that belongs in your accounting system. Use plain labor hours if the purpose is operational improvement. Both can be helpful because a wage increase can change dollars per ton even when the process itself has not become less efficient.
For process improvement
Track labor hours per accepted ton by task: feed/handling, production control, cleanup, quality checks and maintenance support. This shows where time is actually being consumed.
For financial planning
Apply the site’s loaded labor rate to those hours. Keep supervision or corporate overhead separate unless the same accounting boundary is used across every scenario.
Labor is especially sensitive to utilization. A staffed shift that produces fewer accepted tons because feed is irregular, the screen-return loop is overloaded or the line is waiting on material handling will show a higher labor cost per ton even if hourly wages are unchanged. This is why accepted output and staffed time need to be logged together.
5. Maintenance Cost Needs Two Records: Money and Stop Cause
A maintenance ledger that only lists spare-part invoices misses the operating effect. A failed bearing, damaged conveyor belt or screen repair may have a modest parts bill but remove several productive hours. Conversely, planned lubrication and inspection cost money but can prevent a larger stop.
Typical TDF-line maintenance buckets include shredder cutting parts and spacers, bearings and seals, gearbox and lubrication work, hydraulic service on preparation equipment, screen and return-loop wear, conveyor belts and idlers, sensors and switches, structural fasteners, guarding/interlock checks and housekeeping around moving equipment. The actual list should follow the supplier manuals and installed configuration.
6. Build a Shift Log Before You Build a Dollar Forecast
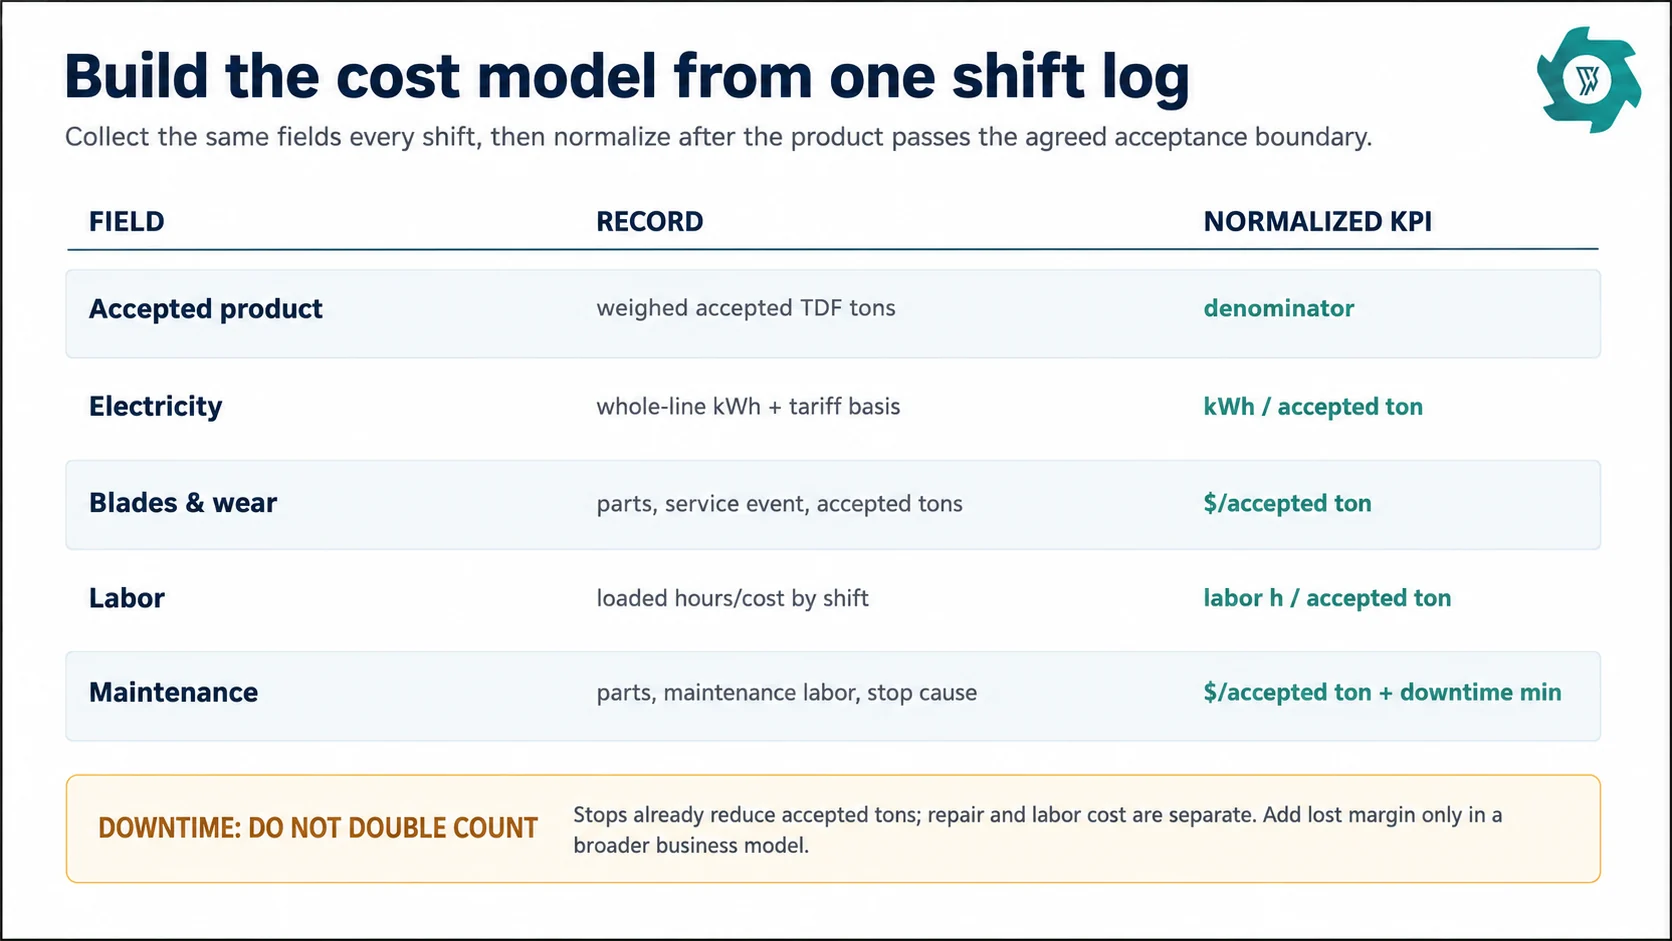
The shift supervisor records accepted output, whole-line kWh, labor hours, blade condition or service events, maintenance work and stoppage cause. Production management then converts those measurements into normalized KPIs. After several comparable periods, the plant has its own evidence instead of relying on a generic web number.
| Shift field | Record | What it answers later |
|---|---|---|
| Feed description | Passenger / truck / OTR share, preparation condition, known contamination events | Did a harder or less controlled feed raise power or wear? |
| Product setting | Screen/configuration ID and receiver acceptance basis | Was the line doing the same job as the comparison period? |
| Accepted output | Finished TDF mass that passed the agreed release boundary | What denominator should every per-ton KPI use? |
| Energy | Start/end meter reading, productive and major idle periods if available | Did kWh/accepted ton change? |
| Blade/wear event | Set ID, condition, action, parts and labor | How many accepted tons were produced between service events? |
| Labor | Hours by production, handling, cleanup and maintenance support | Where did staffed time go? |
| Stops | Duration and cause code | Which constraint reduced accepted output? |
7. Compare Operating Scenarios Without Inventing a Universal $/Ton
Build the first model as a set of transparent assumptions rather than one confident answer. Create low, expected and high cases for accepted output, local electricity price, loaded labor hours, blade-service interval and maintenance allowance. Keep every input visible so it can be replaced after commissioning.
Equipment efficiency, wages, power tariffs, screen requirements and tire mix can all differ. Public sources are best used to identify the variables and to provide external reference points; the site-specific quote needs current supplier data and current local costs. The tire shredder machine price guide covers purchase-scope and total-cost-of-ownership questions.
A simple scenario table
| Variable | Low-cost case asks | Expected case asks | High-cost case asks |
|---|---|---|---|
| Accepted output | Can the line remain well fed and stable? | What output is realistic after normal stops? | What happens during weak feed supply or high return load? |
| Electricity | Coarser accepted product / low recirculation? | Representative screen and tire mix? | Tighter target, more returns, idle auxiliaries? |
| Blades | Controlled feed and long interval? | Normal mixed tires and planned service? | Heavier reinforcement, foreign metal or abnormal damage? |
| Labor | Stable handling and few interventions? | Normal receiving, feeding and cleanup? | Repeated jams, manual rehandling or frequent bin changes? |
| Maintenance | Planned routine work only? | Routine parts plus expected repair allowance? | Early-life issues, abnormal wear or long spare lead time? |
8. Use Commissioning to Create the First Real OPEX Baseline
During commissioning, run a representative tire mix after the line has reached stable operation and record the variables that will later drive the monthly OPEX report. The objective is not to promise one permanent cost; it is to establish a repeatable measurement method.
- Freeze the process boundary. Mark which preparation machines, conveyors, screen/return equipment and auxiliaries are included in the energy and labor measurement.
- Freeze the accepted-product boundary. Use the receiver’s written size, oversize and relevant steel rules so the denominator is not redefined after the test.
- Record the feed. Note tire categories, maximum size and preparation condition; a passenger-tire run should not silently become the baseline for an OTR-heavy plant.
- Meter and weigh during the same stable period. Record kWh, accepted output, fresh feed where useful, labor hours and return-loop observations.
- Record all stops. Separate feed starvation, planned checks, material-handling delays, overloads and maintenance work.
- Save the blade state. A baseline taken immediately after blade replacement should be labeled that way so later power and size trends are interpreted correctly.
9. What to Ask a TDF Equipment Supplier About Operating Cost
Ask which machines are inside the quoted process boundary, what connected loads are installed, which loads cycle, where an energy meter can be placed, how blade and screen service is performed, what spare set is recommended for startup, and which maintenance items require planned access.
Also ask how the supplier defines capacity under the target screen and return arrangement. If a seller gives only fresh-feed tons per hour, you still cannot calculate cost per accepted TDF ton. Request a factory or site test plan that records accepted output, stoppages and the product setting at the same time as electrical data. That gives both sides a shared measurement basis.
- tire mix and maximum tire dimensions, including expected truck / OTR share;
- preparation condition: whole, debeaded, cut or pre-shredded;
- receiver’s written TDF chip and oversize requirements;
- required accepted finished tons per hour and shift schedule;
- local electricity tariff, including demand charges if relevant;
- loaded labor rate or planned staffing assumption;
- which equipment must be inside the plant-gate OPEX boundary;
- preferred spare-parts inventory and local maintenance capability.
Frequently Asked Questions
How much does it cost to produce one ton of TDF?
There is no credible universal dollar figure. Use the same production boundary for every period, add metered electricity, blade and wear cost, direct labor, maintenance parts and maintenance labor, then divide by accepted finished TDF tons. Local power tariffs, wages, tire mix, product specification, utilization and maintenance condition can change the result sharply.
How should electricity cost per ton be measured?
Meter the equipment inside the agreed process boundary during a representative production period. Divide total kWh by accepted finished TDF tons, then apply the actual tariff and any demand charges that belong to the period. Installed motor kW is not the same as energy consumed.
How do I calculate tire shredder blade cost per ton?
Add the blade replacement or sharpening cost, freight and blade-change labor for a service interval, then divide by accepted TDF tons produced between comparable blade-service events. Track tire mix, foreign-metal incidents, screen setting and blade condition so the number has context.
Does a smaller TDF chip size increase operating cost?
It can. A tighter screen can keep more oversize material in the return loop, increasing cutter passes, conveyor duty and wear per accepted ton. The size effect should be measured under the same tire mix and acceptance rule rather than assumed from screen opening alone.
What information should a supplier provide for an OPEX estimate?
Ask for the equipment boundary, connected loads, recommended operating measurements, blade and screen service approach, spare-part list, maintenance points, expected test method, and how target output and return load are defined. Combine supplier data with your local electricity rate, labor cost and operating schedule.
Build the TDF OPEX Model Around Your Actual Tire Mix
Send YUXI the tire categories, maximum dimensions, required accepted TDF size, target finished tons per hour, shift schedule, local electricity tariff and labor assumptions. The project discussion can then separate power, blade, labor and maintenance drivers instead of relying on a generic cost-per-ton claim.
Engineering References
- U.S. EPA, TDF guidance: fuel use and processing context.
- U.S. EPA, scrap tire handbook: cost categories and operating variables.
- U.S. EIA, electricity prices: industrial power-cost variation.
- Washington Ecology, 6PPD report: public shredding-energy reference point.