




Power consumption is one of the easiest tire shredder numbers to misuse. A quotation may list two large motors, a plant manager may know the electricity bill, and an operator may watch current on the HMI. None of those figures, by itself, tells you how much electrical energy is required to make one accepted ton of shredded tire.
The useful production metric is specific electrical energy: kilowatt-hours consumed inside a defined shredder boundary divided by metric tons of accepted output from the same period. That sounds simple, but the result changes quickly when the boundary, tire mix, product size, screen return, test duration or output definition changes.
This guide stays on the primary tire shredder energy question. It does not repeat the broader blade, labor and maintenance accounting covered in the TDF operating cost guide. It also does not turn every high-current event into a fault diagnosis; the separate tire shredder troubleshooting guide covers jams, high amps, reversing and uneven output in more detail.
What kWh per Ton Actually Measures
A kilowatt (kW) is a rate of using power. A kilowatt-hour (kWh) is energy used over time. If a shredder draws an average of 100 kW for one hour, it uses 100 kWh. If it draws that average for half an hour, it uses 50 kWh. Real tire shredding is less tidy because load rises and falls as tires enter the cutters, the shafts recover from difficult bites, material recirculates and the feed conveyor pauses.
That is why energy should be metered or logged, not guessed from one instantaneous screen value. Portable three-phase power loggers can record real power and accumulated energy over a test window, which is the basis needed for a kWh calculation.[1] The same principle applies if the facility has a permanent submeter on the shredder panel.
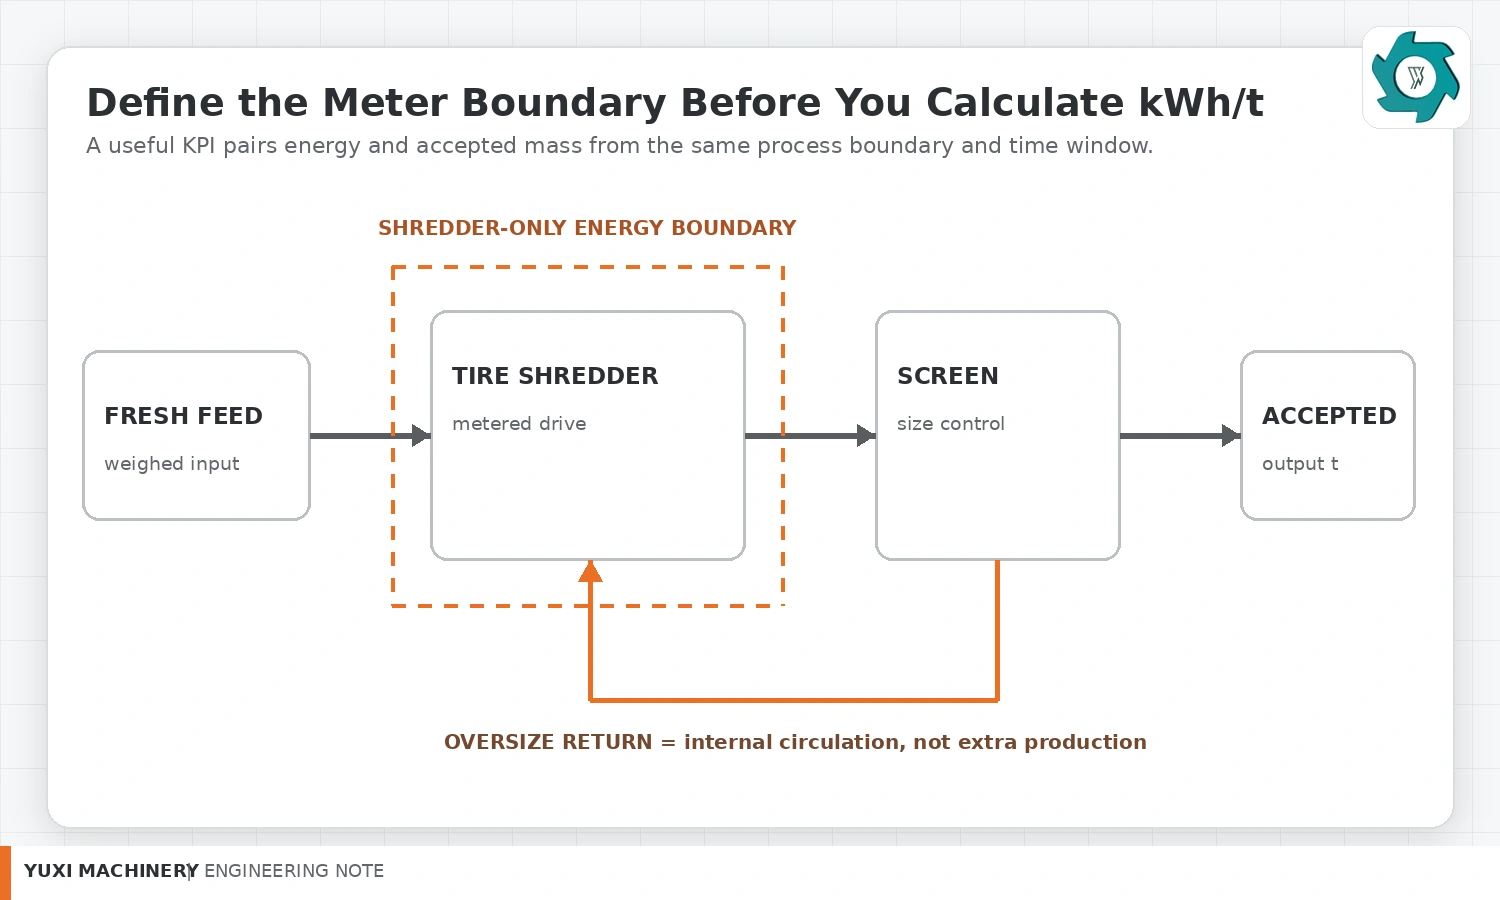
The denominator matters as much as the meter. If 6.0 metric tons enter a system but only 5.2 metric tons cross the agreed accepted-output point before the clock stops, dividing by 6.0 hides retained material, oversize circulation and off-spec output. For production comparison, the safer denominator is the mass that actually crossed the agreed output boundary and met the agreed rule.
This is also why the tire shredder machine should be evaluated together with its screen and return arrangement. A dual-shaft shredder can do useful cutting work while some material remains inside the circulation loop. The electrical meter sees that work even though the final output scale has not counted the mass yet.
Installed Motor kW Is Not the Same as Energy Use
One of the most common budgeting shortcuts is to add the motor nameplate ratings, multiply the total kW by shift hours, and call the answer daily energy consumption. That number can be useful as a conservative connected-load planning value, but it is not a measured production-energy figure.
Motor rating describes the equipment design point, not the exact real electrical input every second. Actual input changes with mechanical load, motor efficiency, drive behavior, power factor and operating state. The U.S. Department of Energy treats motor-system energy management as a system issue that includes motor loading, efficiency and the driven equipment rather than nameplate size alone.[2]
A tire shredder can move through several states in one minute: near-idle rotation, tire engagement, a heavy steel-reinforced bite, control-limited cutting, automatic reverse and restart. The average energy over that minute depends on how long the machine remains in each state. A nameplate value cannot show that sequence.
There is a second problem with nameplate multiplication: it says nothing about output. Two runs may use almost the same kWh but deliver different accepted tonnage. The run with more feed gaps, more recirculation or more retained material will show a higher kWh/t even if the installed motors are unchanged.
Choose the Energy Boundary Before the Test
Before connecting a logger or reading a submeter, write down what is included. There are three useful boundaries, and they answer different questions.
| Boundary | What is inside | Best use | Main risk |
|---|---|---|---|
| Shredder drive only | Main shredder motor(s) and drive system | Compare cutting duty and machine condition | Does not include energy required to move or classify material |
| Shredder cell | Shredder, feed/discharge conveyors, screen and return conveyor | Compare the practical primary-shredding stage | Needs the same auxiliary scope every run |
| Complete line | Preparation, shredding, separation and downstream machines | Plant operating cost and total product energy | Cannot be attributed to the shredder alone |
For this article, the cleanest KPI is shredder-only kWh/t or primary shredder-cell kWh/t. Pick one and keep it fixed. If one supplier includes the return conveyor and another reports only the main motor, the numbers are not comparable.
The same rule applies after installation. If a new magnetic separator, dust fan or hydraulic preparation machine is later connected to the same meter, the historical energy baseline has changed even if the shredder itself has not. Update the boundary record or move the meter so the comparison stays honest.
Measure Accepted Output on the Same Clock
A useful energy test needs two synchronized records: electrical energy and accepted mass. The simplest batch method is to note the meter at the start and end, then weigh the accepted material produced during that exact period.
Do not use “tires processed” as the denominator when the tire mix changes. Passenger tires, truck tires and larger reinforced tires differ in mass and cutting resistance. Count may help operators manage feed, but metric tons make energy intensity easier to compare.
Do not add oversize return tonnage to fresh feed or finished production. Material on the return conveyor has already been counted once as incoming mass. It may cross the cutters again, which increases work, but it is still the same material. Adding every pass as new tonnage can make the machine appear more productive while the electrical meter correctly records the extra cutting duty.
Likewise, do not end the test with a full screen and return conveyor, weigh only the discharge bin, and call the missing mass “loss.” Some of that material is retained inventory. If the test is used for a factory or site acceptance check, either clear the system to a defined end state or record retained material so the mass balance can be closed.
A Practical kWh per Ton Test Procedure
The test does not need to be complicated, but it does need a written basis. The following method works for commissioning, FAT/SAT comparison and routine energy trending.
- Define the feed. Record tire categories, approximate passenger/truck/OTR share, maximum recurring size and whether tires are whole, debeaded or pre-cut.
- Define the target output. Record the screen or size-control setting, accepted size rule and any allowed oversize condition.
- Define the boundary. State exactly which motors and auxiliaries are included in the meter.
- Choose the clock. Record both elapsed test time and productive running time. State which one is used for throughput reporting.
- Stabilize the process. Avoid starting the formal measurement while the return loop is still empty or while a bin from the previous run is still discharging.
- Record start energy. Take the starting kWh value or begin the logger recording.
- Run representative production. Keep the normal operating method. Do not hand-pick only easy tires or remove the screen merely to produce a better number.
- Log events. Mark feed gaps, overload reversals, trips, manual intervention, downstream holds and long idle periods.
- Record end energy and output mass. Stop both records on the same boundary. Weigh accepted output and identify retained or rejected material.
- Calculate and label the result. Report kWh/t together with the feed mix, output rule, meter boundary and test date.
Electrical measurement on energized industrial equipment should be performed only by qualified personnel using procedures and instruments appropriate for the site. The KPI is simple; connecting instrumentation to a live three-phase cabinet is not a casual operator task.
Worked Example: From Meter Readings to kWh/t
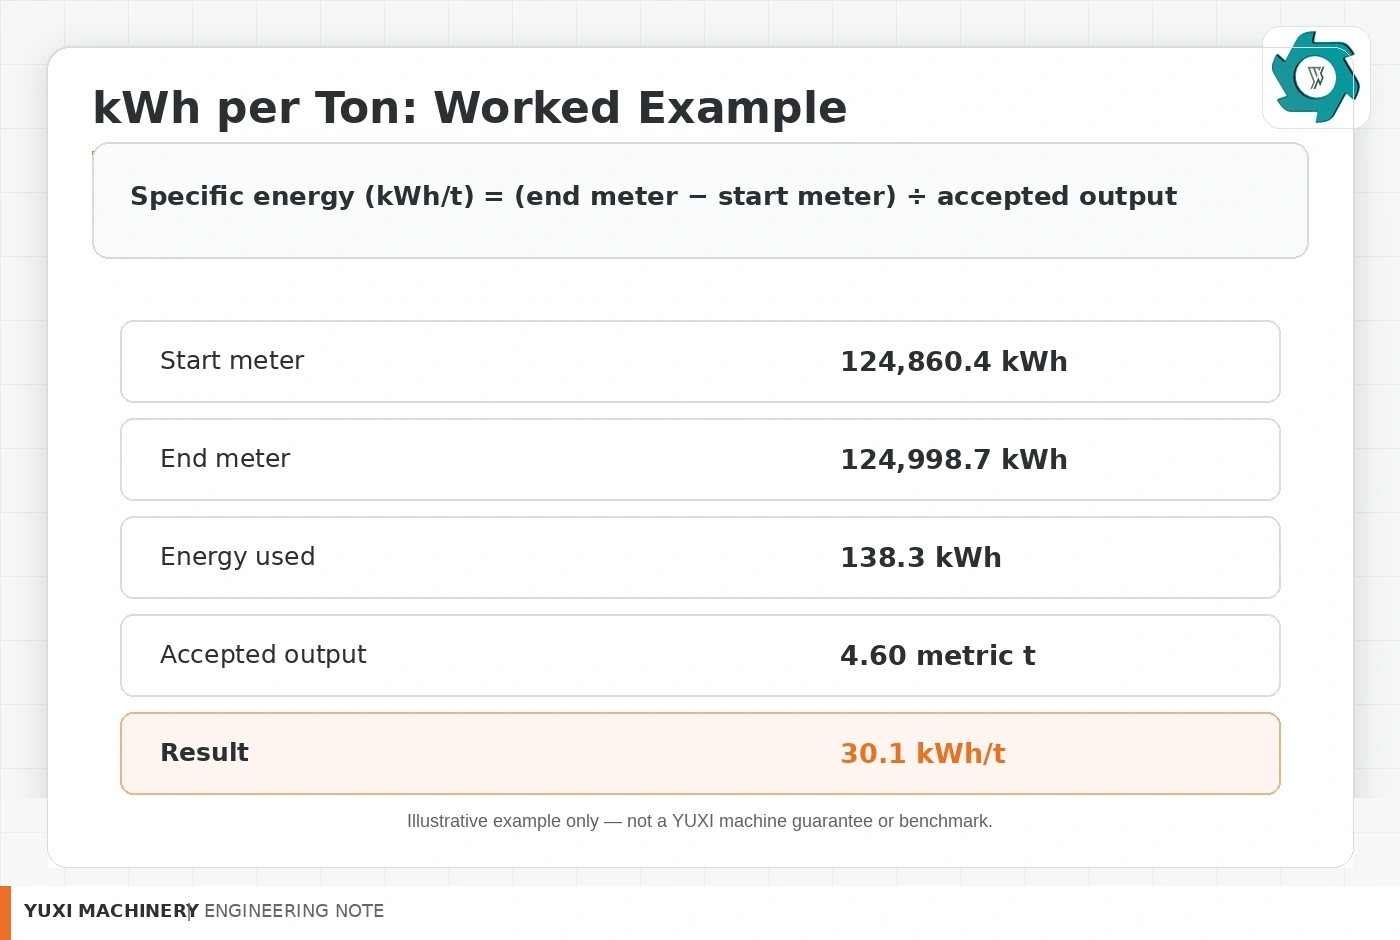
Assume a primary shredder-cell test starts at 124,860.4 kWh and ends at 124,998.7 kWh. The measured electrical energy is therefore 138.3 kWh. During the same window, 4.60 metric tons cross the accepted-output boundary after the agreed screen condition.
If the electricity tariff for the energy component is $0.12/kWh, the energy-only cost for that measured boundary is about $3.61 per accepted metric ton. That is not the total operating cost. It excludes blade service, labor, demand charges, maintenance, loaders and any equipment outside the meter boundary.
Now assume the same machine is tested later with a tighter product setting. The later run uses 139 kWh and makes 4.40 accepted metric tons. The result is 31.6 kWh/t. A previous coarser run used 118 kWh and made 5.20 accepted metric tons, or 22.7 kWh/t. The tighter run is about 39% higher on this specific-energy KPI.
That difference does not prove that the motor has become inefficient. The product setting may have increased recirculation and cuts per ton. Recent research on waste-tire shredding likewise treats energy consumption, throughput and particle-size behavior as linked performance variables rather than independent numbers.[3] For plant decisions, compare runs with the same product target before assigning a cause.
Why Output Size and Oversize Return Change the Number
Whole tires are elastic composites. Rubber stretches, steel reinforcement resists cutting, and irregular pieces can leave the cutter chamber in many shapes. When a screen rejects oversize pieces, those pieces return for more cutting. That improves output control, but it adds work.
A smaller accepted size usually creates more cutting opportunities per ton than coarse volume reduction. Older EPA shredder studies also describe the relationship between size reduction, recycle passes, throughput and power requirements.[4] The exact effect for a modern tire shredder is machine- and feed-specific, so a generic percentage should not be used as a contract number.
For energy trending, it is useful to keep a simple return-load indicator beside kWh/t. The plant may weigh return material directly, estimate it from a belt scale, or use another consistent proxy. The purpose is not to create a second “production” number. It is to explain why the cutters may be doing more work for the same accepted tonnage.
When return load rises, ask why before changing motor settings. The cause could be a tighter screen, a change in tire construction, worn cutting edges, a larger share of truck tires, a feed surge that creates long strips, or a downstream restriction that changes how material clears the screen.
Use a Load Profile, Not One Peak Amp Value
Operators often notice power problems through current. High current can be useful evidence, but current and energy answer different questions. One short current spike may add little energy to a one-hour run. Repeated reversals or sustained high load can add much more.
A logger or drive history becomes more useful when its time stamps are aligned with the event record. The operator can then see whether a high-load period started when a heavy truck tire entered, when oversize material returned in a surge, or when the chamber was almost empty. The event sequence gives the electrical trace context.
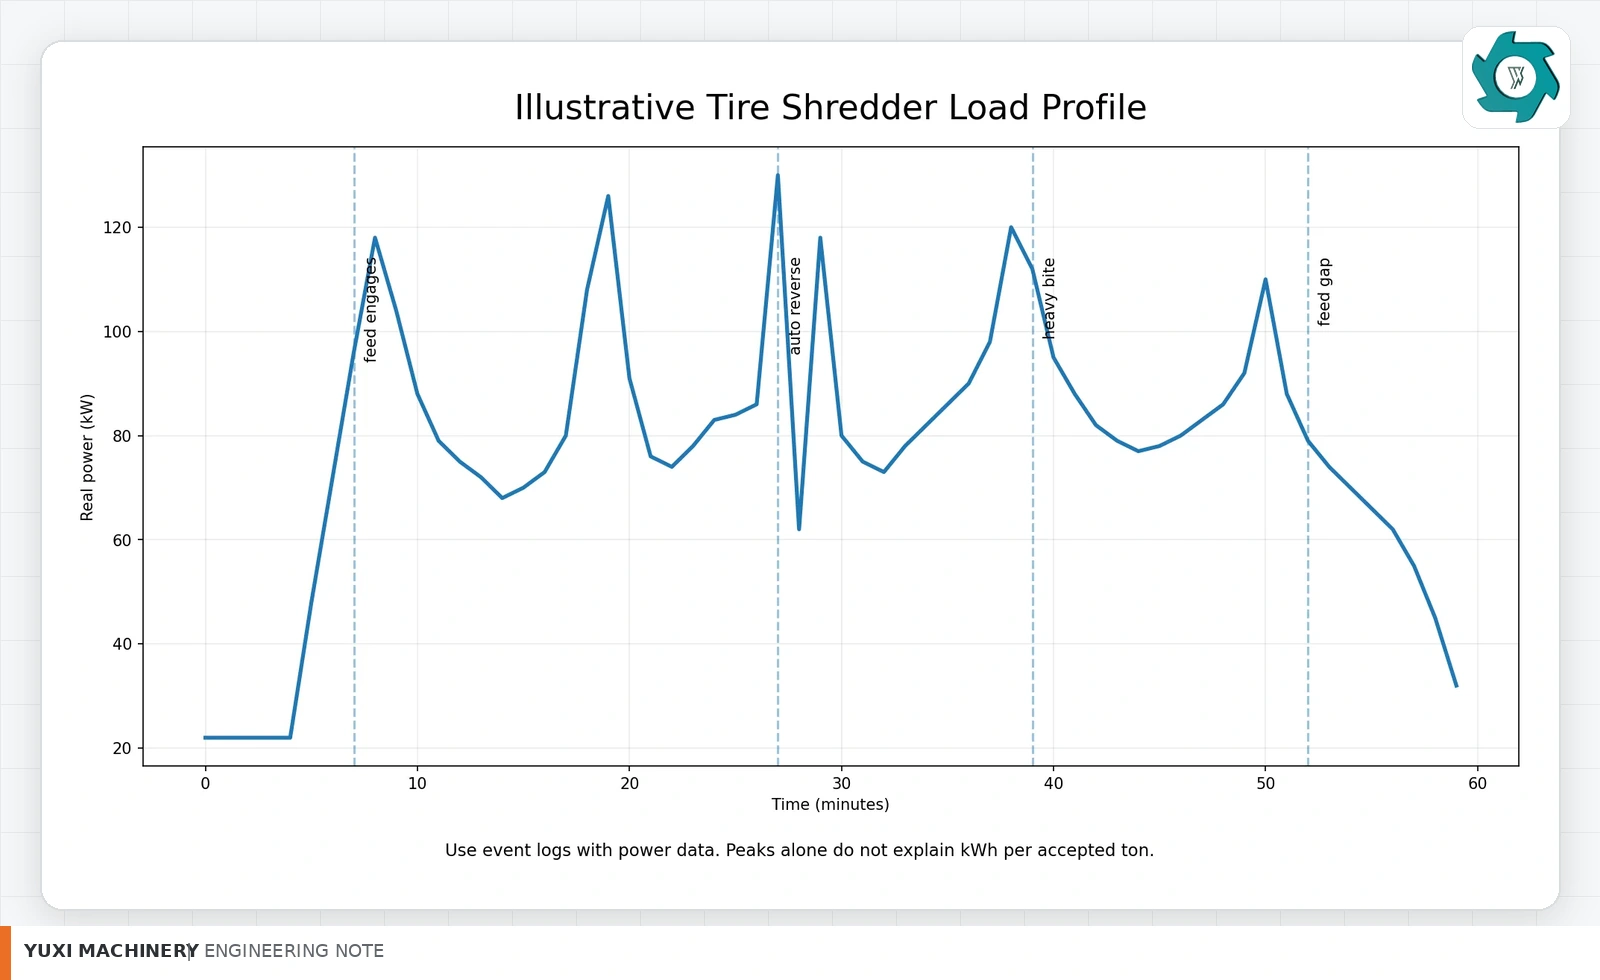
Do not estimate real power from amps alone unless the measurement method is technically justified. Three-phase real power depends on voltage, current and power factor, and VFD-fed systems can add measurement complexity. A suitable power analyzer that measures real kW and kWh directly is better for a production-energy test than multiplying a clamp-meter current by a fixed voltage assumption.
If the HMI already records motor load percentage, current and reverse commands, keep those tags. They are excellent diagnostic signals. Just do not rename them “kWh/t” until the energy and mass calculation has actually been performed.
What Can Push Tire Shredder kWh/t Up?
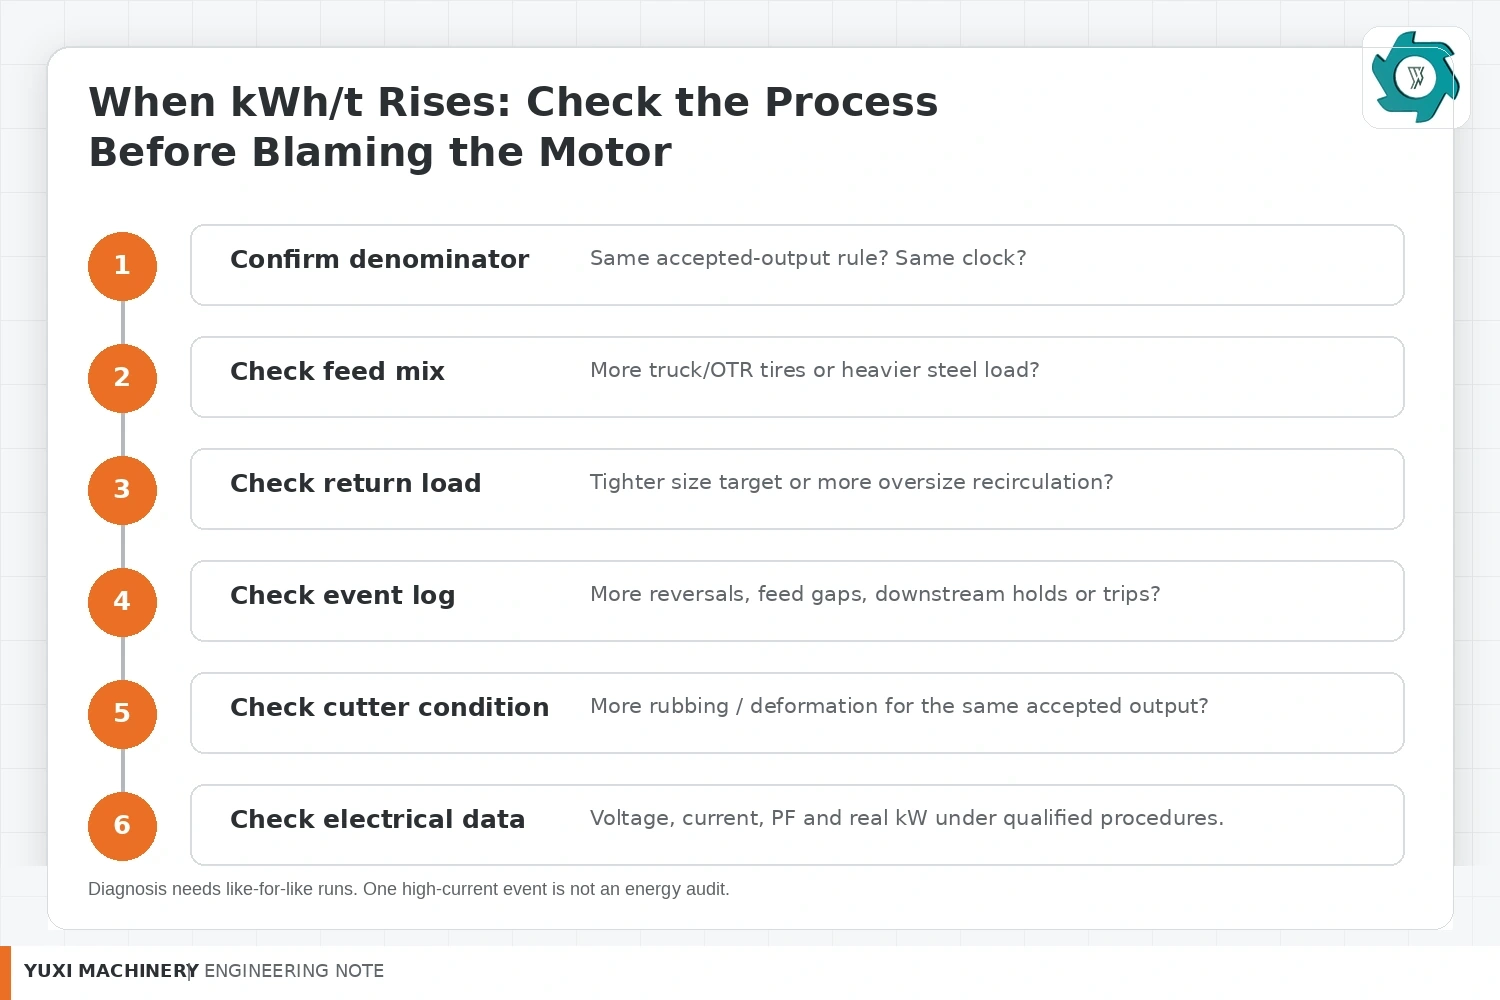
Specific energy is a result, not a diagnosis. When it rises, work through the production record in a fixed order. Start with the denominator, then the process, then the machine and electrical condition.
| Observed change | What it can do to kWh/t | What to check first |
|---|---|---|
| Lower accepted output with similar total kWh | Raises kWh/t quickly | Feed gaps, downstream holds, retained material, tighter acceptance rule |
| More truck or heavy reinforced tires | Can increase cutting work per ton | Feed mix by mass, preparation method, bead condition |
| Higher oversize return | Adds repeated cutting and conveying work | Screen setting, chip shape, cutter condition, return inventory |
| Frequent auto-reverse events | Consumes time and repeated acceleration/cutting work | Event sequence, feed surges, difficult bites, chamber packing |
| Long empty running periods | Uses energy while accepted tonnage stops growing | Loader rhythm, feed conveyor, upstream preparation |
| Worn or damaged cutter condition | May increase deformation, recutting or poor chip control | Output shape, return load, inspection history |
| Downstream blockage | Reduces productive flow while auxiliaries continue running | Screen, discharge conveyor, bins, interlocks |
| Electrical supply or drive abnormality | Can affect losses, current and available torque | Qualified electrical measurements and alarms |
Blade condition deserves special care because it can overlap with several symptoms. Do not diagnose wear from energy data alone. Compare kWh/t with output shape, return percentage and the maintenance record. For blade wear, sharpening and replacement decisions, use the dedicated tire shredder blade guide instead of turning this energy article into another blade-cost page.
Separate Idle Energy from Production Energy Without Hiding It
Idle periods are real electricity use. If the purpose is to calculate plant operating cost, keep them in the gross production-energy number whenever they occur inside the agreed production window. Removing every non-cutting minute can create a laboratory number that the monthly bill can never reproduce.
For diagnosis, however, a second KPI can be useful. Measure the stable no-load or near-idle draw of the defined shredder cell and compare how much of a test is spent in that state. If the machine consumes 20 kW while waiting and a shift accumulates one hour of avoidable feed starvation, that is 20 kWh of energy without accepted production. The exact numbers vary by configuration; the principle is what matters.
Keep the two metrics separate:
- Gross production kWh/t: all metered energy inside the agreed production window divided by accepted tons.
- Cutting-duty diagnostic: a process-engineering metric that may separate baseline idle energy from loaded energy to compare mechanical duty.
Do not use the diagnostic number for electricity budgeting unless its exclusions are clearly added back. A plant pays for the gross electrical energy, not only the part attributed to cutting.
Why Feed Stability Matters Even When the Motor Is Efficient
A well-designed motor cannot compensate for a poor material rhythm. If a loader dumps several tires at once and then leaves the shredder empty, the drive sees load peaks followed by nonproductive running. A steadier feed can improve utilization of the available cutting chamber and reduce the share of energy spent waiting.
That does not mean the correct target is “keep the motor at the highest load possible.” Excessive feed can pack the chamber, trigger repeated reversals, overload the return system or create an unstable discharge. The useful target is stable accepted output at a controlled load, not maximum amperage.
For routine tracking, add three simple production fields beside kWh/t: accepted t/h, reversal count per accepted ton, and minutes of feed starvation per hour. They do not replace engineering analysis, but together they distinguish several common situations. High kWh/t with low feed starvation suggests a different problem from high kWh/t caused by an empty conveyor for twenty minutes of each hour.
Compare Like-for-Like Runs
Energy intensity becomes valuable when the plant builds a baseline. Use several normal runs, not one unusually good shift. Record the same fields every time so the next comparison has context.
| Field | Why record it |
|---|---|
| Date / machine ID | Links the number to maintenance and control changes |
| Tire mix by mass | Prevents passenger-tire runs from being compared with truck-heavy runs |
| Preparation state | Whole, debeaded and pre-cut feed can create different cutting duty |
| Target size / screen setting | Size control strongly affects recirculation and accepted throughput |
| Accepted tons | Defines the denominator |
| Metered kWh | Defines the numerator |
| Elapsed and running time | Shows whether output loss came from stops or cutting rate |
| Return-load indicator | Shows repeated internal processing |
| Reverse count / alarms | Provides process-event context |
| Cutter service state | Connects the energy trend with wear history |
A baseline should also note major maintenance or control changes. If blades were replaced, a screen was changed, VFD parameters were revised under an approved procedure, or a new return conveyor was installed, mark the date. Otherwise a trend chart can show a sudden “efficiency improvement” with no explanation.
The maintenance schedule should own those change records. The tire shredder maintenance checklist is the better place to manage daily, weekly and shutdown tasks; this article only uses maintenance history as context for the energy KPI.
How to Use kWh/t in a Factory Acceptance Test
A buyer can include an energy measurement in a FAT, but the clause must define the same conditions used for capacity. A statement such as “power consumption shall be below X kWh/t” is incomplete if it does not define tires, preparation, output size, accepted mass, meter boundary and test duration.
A stronger test clause describes the method:
The contract can then set a project-specific acceptance range based on the supplier’s demonstrated test data. Do not borrow a kWh/t figure from a different plant, an LCA database or a vendor brochure and assume it will hold for another tire mix and product size.
Convert kWh/t to Electricity Cost per Ton
Once the energy KPI is measured, the energy-cost calculation is straightforward:
Keep demand charges, time-of-use pricing, taxes and other tariff items separate unless the plant has a clear method to allocate them. A low kWh/t machine can still create a high demand peak if large motors start or load at the same time as other plant equipment. Energy use and demand are related billing issues, but they are not the same line item.
For project budgeting, use local tariff data and the production schedule. A one-hour test tells you specific energy under that condition. Annual electricity depends on how many accepted tons are produced, how often the line idles, how the mix changes and how the tariff is structured.
Common Calculation Mistakes
1. Multiplying nameplate kW by shift hours
This creates a connected-load estimate, not measured production energy. Keep it for electrical planning, not as proof of kWh/t.
2. Dividing by fresh input when the screen is full of retained material
The meter has already paid for some work that has not yet become accepted output. Use the agreed accepted boundary or close the mass balance before ending the test.
3. Counting oversize return as additional production
The return conveyor shows repeated cutting duty. It should never be added to fresh feed or accepted output as though the same rubber became two tons.
4. Comparing different chip-size targets
A coarse volume-reduction run and a tighter screened product do not impose the same cutting duty. Record the output rule with every energy result.
5. Using one peak amp reading as energy consumption
Current helps diagnose load. Energy requires real power integrated over time, preferably measured with suitable metering.
6. Removing every stop from the test without reporting it
That can create an unrealistically clean number. Report stable-running performance and practical elapsed-window performance separately when both matter.
7. Treating a published benchmark as a purchase guarantee
Published studies are useful for understanding relationships and building a measurement plan. They do not replace a project-specific test on the actual tire mix, product size and machine configuration.
What to Send YUXI for an Energy-Based Shredder Comparison
If electrical consumption is important to the project, include it in the RFQ before the machine is selected. Send the tire mix by approximate mass, maximum recurring tire size, whether bead wire is removed, target chip size, required accepted t/h, available voltage/frequency, working hours and the intended meter boundary.
Also state whether you need a shredder-only energy figure or a shredder-cell figure that includes screening and return. If the line will run different products, define at least the main operating cases instead of asking for one universal kWh/t number.
During commissioning, keep the first stable runs as a baseline. Later, the same KPI can help decide whether a change in energy use came with a change in output, feed mix, recirculation or machine condition. That makes kWh/t more useful than a one-time sales claim.
Frequently Asked Questions
How do you calculate tire shredder kWh per ton?
Subtract the starting energy-meter reading from the ending reading to get kWh used during the test. Divide that energy by the metric tons of accepted output produced during the same test window. Record the tire mix, output-size rule and meter boundary with the result.
Can I calculate power consumption from motor kW?
Motor nameplate kW can support connected-load and electrical-system planning, but it does not show the actual energy used during changing shredder loads. For production energy, meter real kWh over time.
Should oversize return be included in tons processed?
No. Oversize return is internal circulation. It can be logged to explain cutting duty, but adding it to fresh input or accepted output double-counts the same material.
Why does kWh per ton rise when output size gets smaller?
A tighter size target can keep more material in the screen-return loop and create more cutting events before the product is accepted. The actual change depends on tire construction, cutter condition, screen setting and operating stability.
Is high motor current the same as high kWh per ton?
No. Current is an instantaneous or short-interval load signal. kWh per ton combines real electrical energy over time with accepted output mass. A brief current peak may have little effect on the final energy intensity, while repeated reversals or long loaded periods can have a larger effect.
What should be included in a tire shredder energy FAT?
Define the tire mix, preparation state, target output, meter boundary, accepted-output weighing point, stable test window, running and elapsed time rules, event log, retained material treatment and the formula used to calculate kWh per accepted metric ton.
Need a Tire Shredder Configuration With a Measurable Energy Test?
Send your tire mix, target chip size, accepted capacity, power supply and planned operating hours. YUXI can define a practical shredder configuration and a test boundary that lets you compare kWh per accepted ton instead of guessing from motor nameplates.
References
- Fluke energy guide — portable energy logging and watt-hour measurement context.
- DOE motor systems — motor-system energy management and efficiency resources.
- Shredding study — waste-tire shredding research linking process variables, throughput, particle behavior and energy consumption.
- EPA shredder report — historical engineering context on size reduction, recycle passes, throughput and shredder power requirements.