




A truck-tire-heavy feed does not simply mean “fewer tires per hour.” It changes the mass per piece, concentrated bead load, cutting work and the evidence needed to make a credible capacity or blade-life claim.
1. Compare the Processed Product, Not Just the Tire
The useful question is not which tire class is “better” for TDF. It is whether a defined feed lot can be converted into the receiver’s accepted fuel at a stable rate. ASTM D6700 treats TDF as a processed fuel product, while the U.S. EPA notes that size reduction and, depending on use, de-wiring may be required.1, 2
Keep these conditions fixed before comparing passenger and truck tires: accepted chip-size band, maximum oversize, allowable steel or exposed wire, feed preparation, screen opening, downstream magnetic arrangement and the definition of running time. If one test produces coarse chips and the other uses a tight screen with high recirculation, the output rates are not comparable.
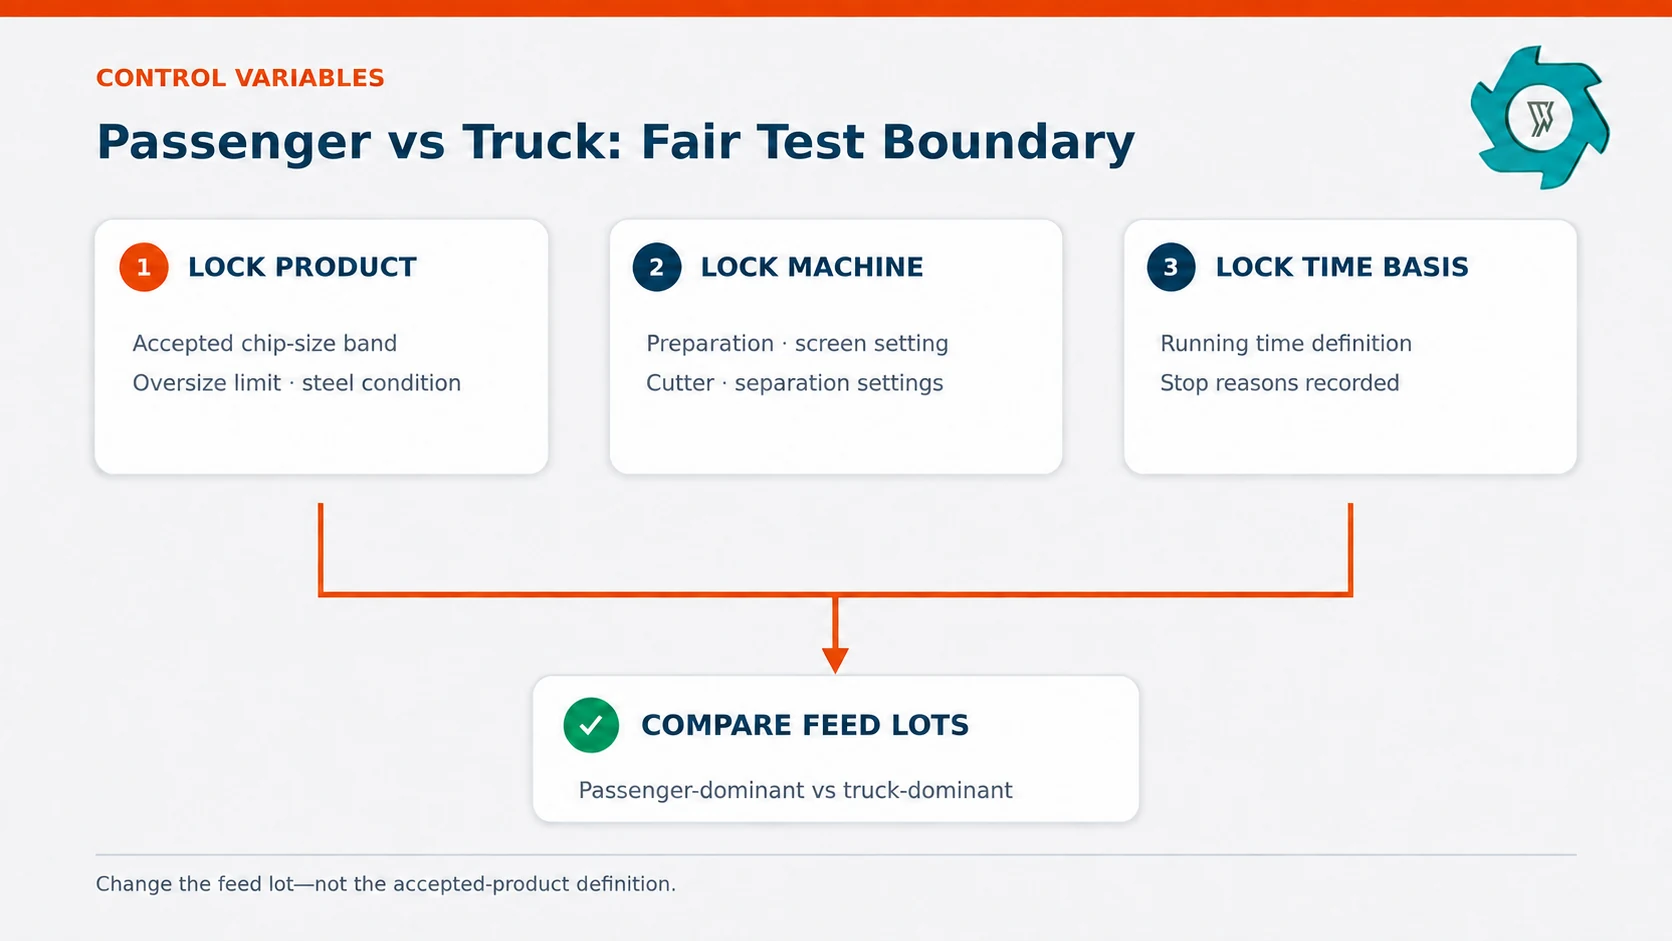
2. What Actually Changes Between Passenger and Truck Tires?
FHWA’s material description gives a useful scale reference: a typical scrap automobile tire was listed at about 9.1 kg (20 lb), versus about 18.2 kg (40 lb) for a typical truck tire.3Real lots vary by tire size, casing type, residual tread, retread history and moisture or debris.
| Operating factor | Passenger-tire-dominant lot | Truck-tire-dominant lot | What to verify |
|---|---|---|---|
| Piece handling | Lower mass per tire; whole-tire metering may be simpler | Heavier and larger pieces; loader placement and infeed opening matter | Largest diameter, width and mass—not only the average |
| Bead zone | Concentrated bead steel still present unless removed | Heavier bead package can raise shock load and preparation demand | Bead-treatment route and removed bead mass |
| Carcass | Mixed rubber, textile and steel construction | Construction can be thicker and more heavily reinforced | Representative cut sections or supplier lot description |
| Feed count | More pieces are needed for one ton | Fewer pieces may represent one ton | Record both count and scale mass |
| Process response | Often steadier whole-tire feeding | May require cutting to stay within the shredder feed envelope | Motor load, reversals, bridging and running time |
Do not treat “truck tire” as one homogeneous feed. Medium-truck, bus, super-single and mixed retread casings can create materially different handling and cutting loads.
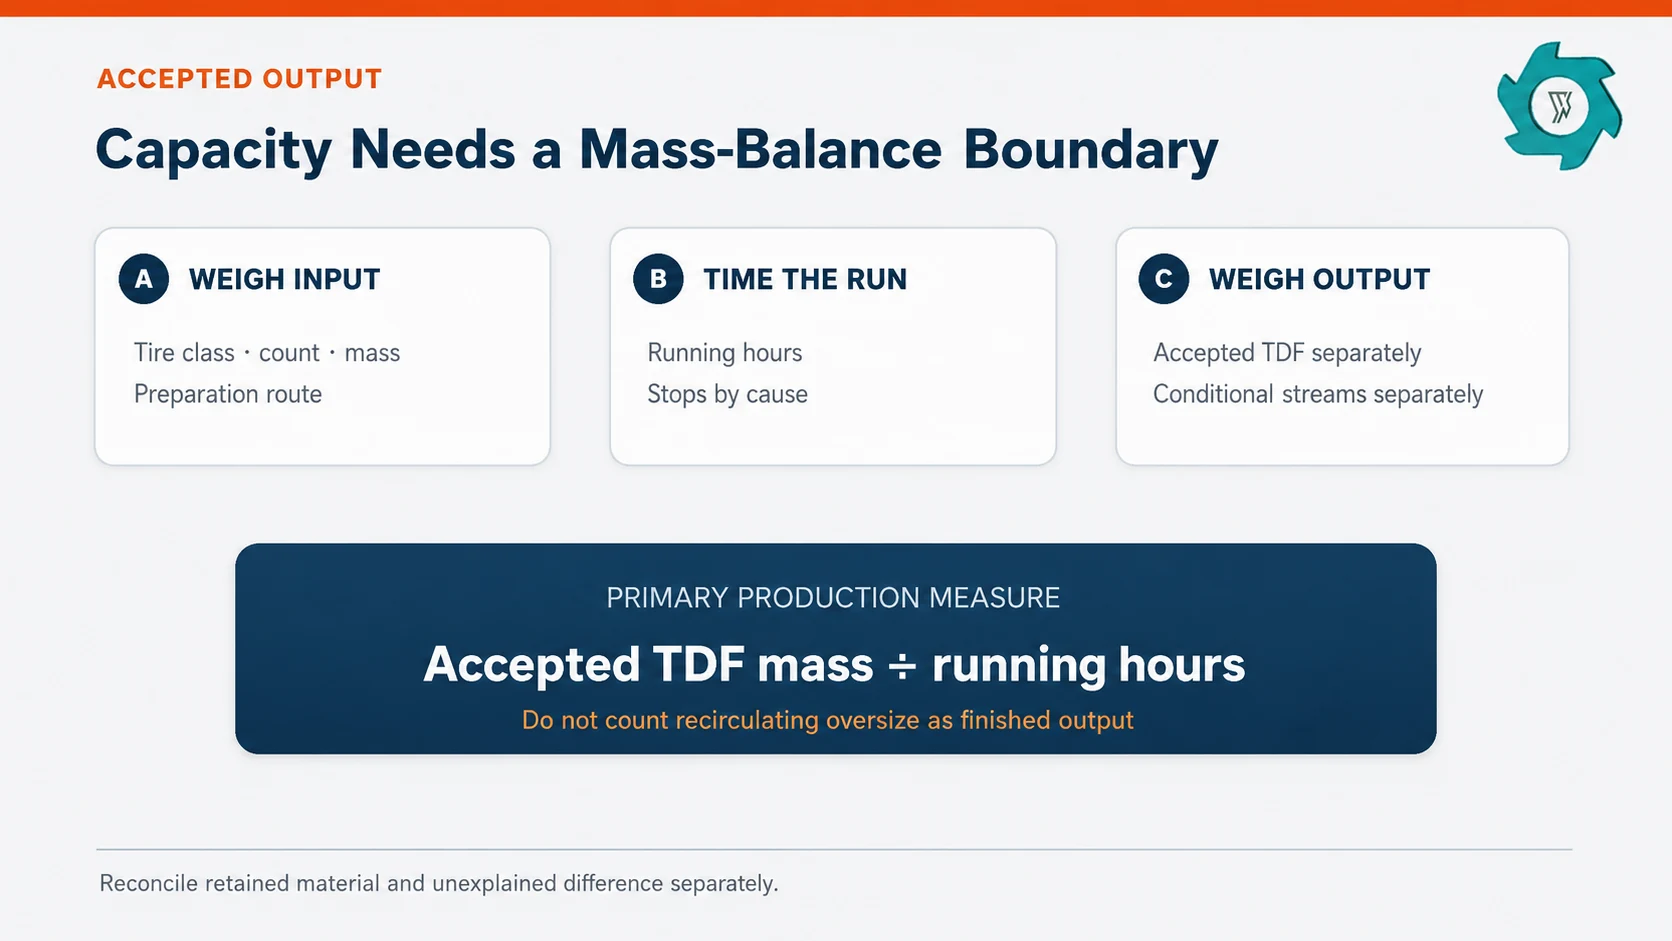
3. Capacity: Use Accepted Tons, Not Tire Count
A tires-per-hour figure rewards lighter feed. It can make a passenger-tire run look faster even when the accepted mass rate is lower. Conversely, gross feed tons can overstate production if a truck-tire run generates more oversize return or retained material.
Report scheduled hours, powered hours and running hours separately.4 Stop-time categories should include feed starvation, bridging, foreign material, overload reversal, screen clearing and planned cutter inspection. For a line using screen-controlled sizing, a tighter target raises the chance that material returns for another cut; the YUXI Tire TDF Plant therefore defines output through screening and an oversize-return loop rather than by the first-pass shred size.
For a more detailed treatment of screen effects, use the tire shredder output size guide.
4. Steel Burden: Separate Bead Steel from Remaining Reinforcement
Bead treatment removes the concentrated bead bundle. Steel belts or carcass reinforcement may remain and become exposed during cutting. That distinction matters to cutter loading, magnetic capture and the receiver’s fuel specification.
For each lot, record three different quantities where the process has those streams: bead steel removed before shredding, magnetically recovered steel after size reduction and steel still present in accepted chips. Do not combine them into one recovery number. If the receiver specifies a steel limit, use its sampling and reporting method; visual wire exposure alone is not a substitute for a mass-based result.
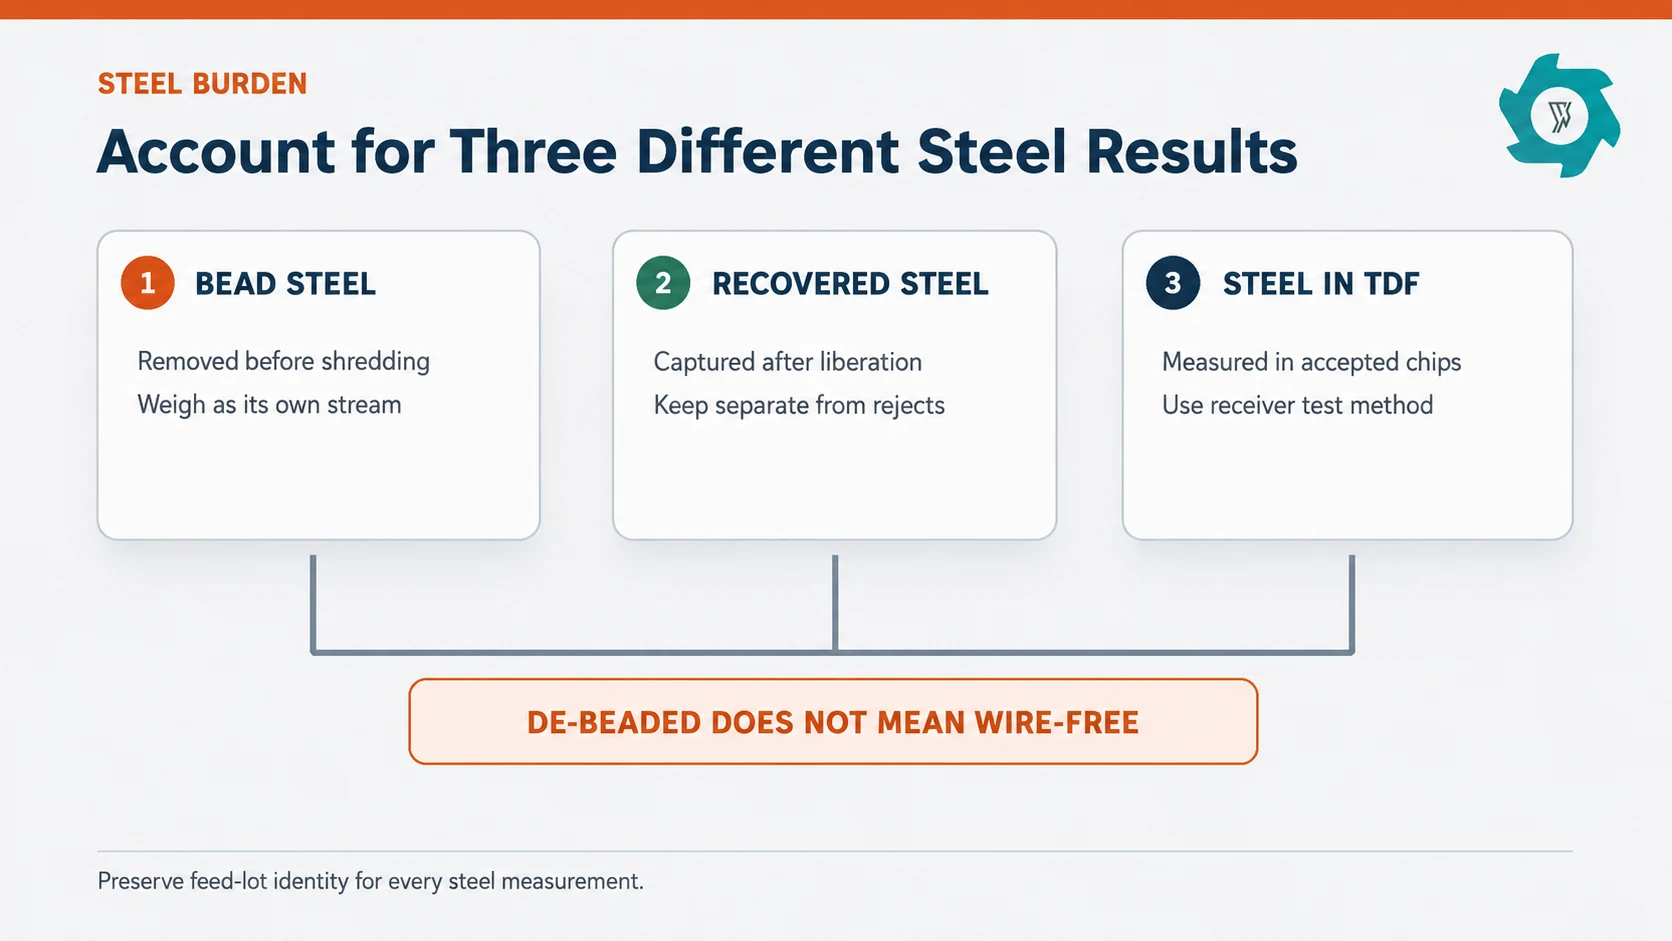
The dedicated guide to TDF steel-wire requirements explains receiver-driven limits in more detail. For this passenger-versus-truck comparison, the key is to preserve the feed-class identity of every steel measurement.
5. Blade Wear: Normalize by Work Done
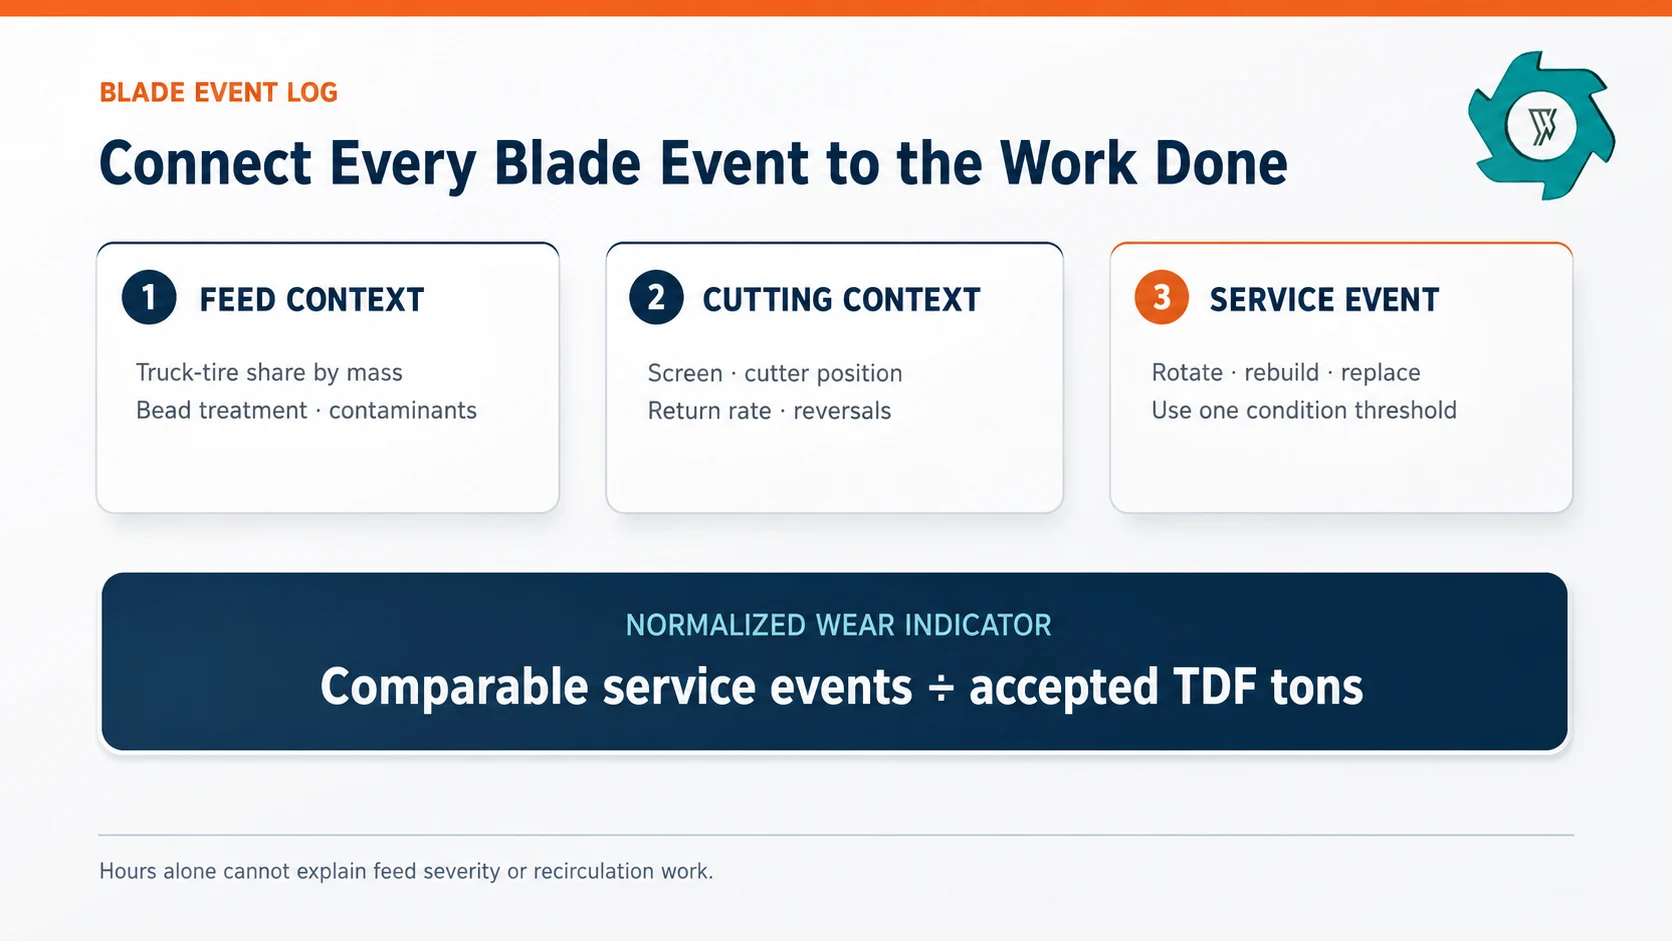
Hours between service events are easy to collect but weak for comparison. An idle or lightly loaded hour does not equal a high-torque hour with repeated recirculation. Track accepted tons between comparable cutter rotations, reversals, rebuilds or replacements. Keep the service rule consistent: the same edge-condition threshold, inspection method and position map.
Truck-tire share is only one explanatory field. Also retain bead-treatment status, accepted size, oversize-return rate, foreign-metal events, cutter material, cutter position and operator notes. A single piece of rim metal can cause damage unrelated to normal tire reinforcement. Likewise, a tighter product size can raise cutting contacts per accepted ton even when the tire mix is unchanged.
If the goal is cost rather than physical wear, the TDF operating-cost guide shows how to keep blade, energy, labor and downtime records from being double-counted.
6. A Practical Two-Lot A/B Test
- Define the lots. Run a passenger-dominant lot and a truck-dominant lot. Weigh each lot and record tire count, class, size range, obvious contamination and retained water.
- Lock preparation. State whether beads are pulled, cut or left in place and whether tires are quartered or otherwise pre-cut.
- Stabilize the line. Bring the shredder, screen and downstream separation to steady operation before the timed window.
- Run the same product setting. Keep screen, cutter arrangement and acceptance criteria unchanged.
- Weigh every relevant stream. Accepted TDF, oversize or return, bead steel, downstream recovered steel, rejects and retained material must remain distinct where present.
- Record time and events. Separate running time from stops; capture reversals, jams, inspections and cutter intervention.
- Reconcile mass. Compare weighed input with weighed outputs plus retained material. Show unexplained difference separately rather than hiding it in rejects.
- Repeat if variability is high. One short run may describe that lot, not the year-round feed mix.
The TDF production-process guide can be used to map these measurements onto bead treatment, cutting, shredding, screening and steel control.
7. Turn a Mixed Feed into a Measurable Production Case
Annual tire counts are not enough to size a mixed-feed plant. Convert the forecast to mass before applying it to a capacity or wear model. If a project expects 80% passenger tires and 20% truck tires by count, truck tires can still represent a much larger share of the processed mass because each piece is heavier.
Then calculate burden indicators against accepted output, not gross input. Three ratios are especially useful:
| Indicator | Calculation | What it reveals |
|---|---|---|
| Pre-shred bead burden | Removed bead steel ÷ weighed feed | How much concentrated steel the preparation stage diverted |
| Downstream steel burden | Magnetically recovered steel ÷ accepted TDF | Steel-separation load per saleable or usable ton |
| Return-load ratio | Oversize sent back ÷ accepted TDF | Extra circulating material handled for each accepted ton |
A worked example without a false performance promise
Suppose a timed run receives 20 t of tires and produces 16 t of accepted TDF. During the same boundary, 1.5 t of steel is recovered, while measured rejects, retained material and the separately reported reconciliation difference account for the remaining input mass. The return conveyor handles 3.2 t during the run, but this circulating mass is not added again as a mass-balance output. The return-load ratio is 3.2 ÷ 16, or 0.20 t of circulating oversize per accepted ton. The downstream steel burden is 1.5 ÷ 16, or 0.094 t per accepted ton.
Repeat the calculation for the passenger-dominant and truck-dominant lots. The difference isolates where the heavier feed changed the process: preparation, recirculation, steel control or actual cutting rate.
8. Exclude Changeover Material and Report Uncertainty
An A/B test becomes misleading if the first minutes of the truck-tire run still contain passenger-tire material in the hopper, shredder chamber, conveyor and return loop. Define a purge or transition rule before timing. Begin the measured lot only after the previous feed is cleared and the output stream has stabilized; retained material at the boundary must be estimated or weighed and shown in the reconciliation.
Use short time blocks to expose instability
Do not report only one average for a long test. Divide the stable window into equal increments—such as five or more blocks—and calculate accepted t/h, return-load ratio and overload reversals for each block. The spread shows whether the result was repeatable or dominated by one smooth interval.
| Result pattern | Likely interpretation | Next check |
|---|---|---|
| Average capacity falls; return load rises | More material is recirculating at the fixed screen setting | Inspect chip-size distribution and cutter condition |
| Average capacity falls; reversals rise; return load is stable | Primary cutting or feeding load has increased | Review tire dimensions, bead preparation and motor-load trend |
| Steel burden rises; capacity is stable | Downstream separation sees more steel per accepted ton | Check magnet loading and accepted-chip steel result |
| Only one block performs poorly | A jam, foreign-metal incident or feed interruption may dominate the average | Retain the block but annotate the cause; do not silently delete it |
Report a range before claiming a feed effect
For each lot, publish the block average together with the minimum and maximum—or a standard deviation when the team uses statistical reporting. If the passenger and truck ranges overlap heavily, the test may not support a strong feedstock conclusion. Longer runs, repeated lots or tighter control of preparation may be needed. This prevents a supplier or buyer from treating normal process variation as a precise truck-tire penalty.
Map wear by cutter position
During each scheduled inspection, use the same position map and record edge rounding, chipping, hook loss and abnormal impact marks. Compare drive-side, center and discharge-side positions separately. A localized chip after a rim-metal incident should not be presented as normal truck-tire abrasion; conversely, repeated rounding across the same high-load positions may justify a different rotation interval.
9. How the Comparison Changes Equipment Selection
A passenger-tire-dominant plant may prioritize steady whole-tire metering and high piece count. A truck-tire-heavy project should verify infeed dimensions, torque reserve, reverse logic, bead-treatment capacity, pre-cutting labor or machinery, screen return and safe handling of heavier pieces.
Ask a supplier to quote at least two operating points: the planned baseline mix and a credible high-truck-tire case. Each point should name feed preparation, tire envelope, accepted output size, steel condition and the capacity measurement boundary. The tire shredder machine overview is a useful starting point for matching tire dimensions and steel content to the shredder configuration.
| Supplier field | Required entry | Evidence to request |
|---|---|---|
| Feed mix | Passenger / light truck / medium and heavy truck percentages by mass | Lot sheet and scale tickets |
| Largest tire | Diameter, width and mass | Measured maximums, not nominal class alone |
| Preparation | Bead treatment and pre-cut size | Flow boundary and preparation throughput |
| Product | Accepted size band, oversize method and steel requirement | Sampling plan and separate stream weights |
| Capacity | Accepted t/h and running-time definition | Increment records, stop log and mass reconciliation |
| Wear basis | Accepted tons between defined service events, with exclusions stated | Dated cutter-position inspection sheets |
Frequently Asked Questions
Can passenger and truck tires run on the same TDF line?
They can when the tire dimensions, mass, construction and required chip specification fall within the line’s validated feed envelope. Truck tires may require bead treatment or pre-cutting before stable feeding.
Do truck tires always reduce TDF capacity?
Practical accepted throughput depends on preparation, screen opening, oversize return, steel burden, cutter condition and the truck-tire share of the feed.
Should capacity be compared by tires per hour or tons per hour?
Use accepted tons per running hour as the primary production measure. Tire count is useful for feed tracking but can mislead because truck tires are much heavier than passenger tires.
Does removing truck-tire bead wire remove all steel?
No. Bead treatment removes concentrated bead steel, while belt and carcass steel can remain in the tire and must be handled by the shredding and downstream steel-control system.
How should blade wear be compared between feed mixes?
Record accepted tons between comparable service events, together with truck-tire share, bead-treatment status, screen setting, foreign-metal incidents and cutter position. Hours alone do not normalize the work performed.
What should a mixed-feed FAT report?
Report each feed lot separately, including tire class and mass, preparation route, running time, accepted output, oversize return, recovered steel where present, energy and cutter or jam events.
Define Your Tire Mix Before Sizing the Line
Send the passenger/truck split by mass, largest tire dimensions, bead-treatment plan, required TDF size and receiver steel condition. YUXI can use that boundary to propose a testable line configuration.
Engineering References
- ASTM International, D6700 standard. Scrap-tire-derived fuel guidance.
- U.S. EPA, TDF guidance. Size reduction and de-wiring context.
- Federal Highway Administration, scrap tires. Tire-mass and recovery context.
- ASTM International, E1107 standard. Throughput measurement reference.